Resource: Python for Physics and Astronomy
1 - Plotting Graphs
Objectives:
- To produce a code that can generate a graph of a mathematical function.
- To produce a graph from a set of experimental data.
- To be able to label axes, include gridlines and save a graph as an image file.
This is the simplest form of mathematical modelling, to graphically see how one variable influences another. We use graphs all the time in science and it is a good place to start to code.
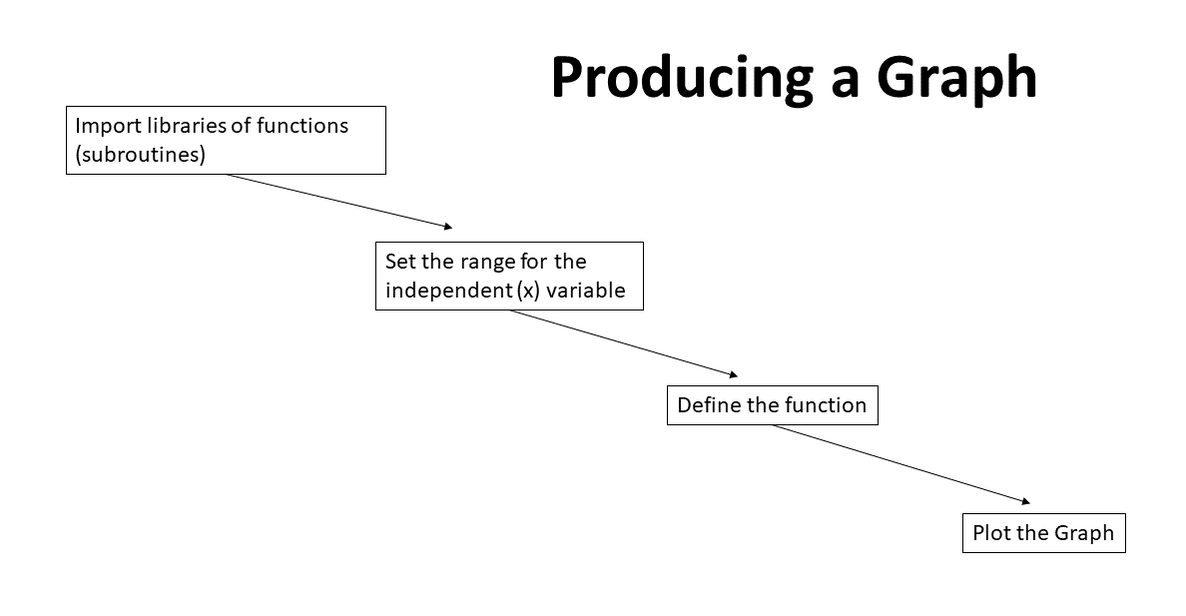
Example 1 - A simple graphing code for a function (on line line 10) that runs over a range defined by line 8, in this case from 0 to 20 at intervals of 0.1. Changing the range and function can be easily done in the code.
Note that in the python language \(y^x\) is written as y ** x . Using brackets in coding is recommended.
Experiment with changing the range, interval and function as well as axes labels.
Note that in the python language \(y^x\) is written as y ** x . Using brackets in coding is recommended.
Experiment with changing the range, interval and function as well as axes labels.
Plotting a Graph of Experimental Data
1.2 - Kinematics
1.3 - Animations
Example 2 - Bola Toss written by Let's Code Physics. This uses VPython which is better for animations. It involves two balls connected by a spring that are thrown into the air. The balls are defined as red and green. The vectors are their starting positions (x, y, z).